Somewhere along the way, data became a four-letter word. I’m sure it all started back when lawmakers became more focused on test scores and less on students…and High Stakes Testing became the only thing that only mattered… but somewhere along the way, data became a word that was like nails on a chalkboard for teachers.
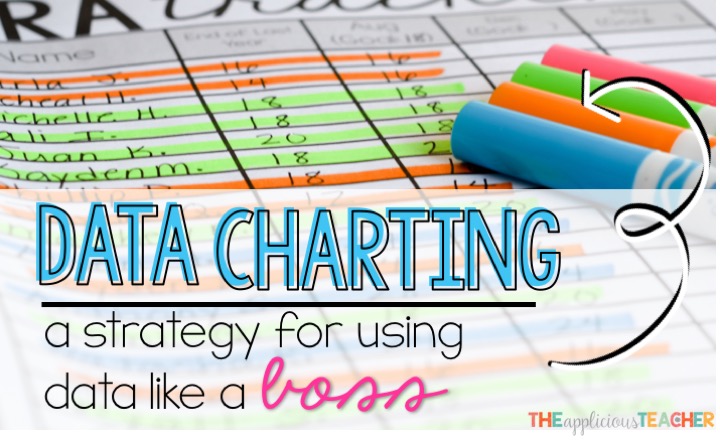
When I talk to teachers about data, the majority of them are either overwhelmed by all the data they must keep, or just are frustrated with how data is being used “against” themselves and their students. I can feel that pain! I’ve spent many a-meetings staring at a data wall being told that my data needed to improve, but was never really shown how or what the issues were. I mean, what did it all mean? Or more importantly, what do I do now? So, after some YEARS of combing through data, I’ve found a way that was super effective for me… that is Data Charting!
Free Data Tracker!

Subscribe to our email list and receive this data charting sheet right to your inbox!
Data Charting
So what is Data Charting? Simply put, it’s a systematic and routine way of combing through data as a teacher (along with your team). This system allows you to see your students’ exact weakness, strengths, and helps guide you to what you should do next to meet their needs. Sounds too good to be true? I know, this system seems to promise A LOT, and probably has you wondering how time-consuming the process is. But, I promise it doesn’t take long and the pay-off is worth the few extra minutes!
Now, I can’t take all credit for this little system or the forms that I’m sharing in this post. I had help! This system is a combination of what I did with my own personal student data in previous years and a system that a dear friend of mine uses at her school. As the principal, she’s lead tons of data chats, and wanted a way for teachers to better understand their data and then move forward with it. We’re both passionate about helping students achieve and providing the tools for teachers to do it. So the forms and system I’m sharing below is the brain child of our passions!
Getting Started
So are you ready to comb through that data? Let’s get started! First, you need some data from a recent assessment (obvi!). This can be a pre-assessment, common formative assessment, or a diagnostic assessment like I’m using the sample for this post. This form is designed to be used for reading and math, but could totally work for other content areas. Data charting can be done by one teacher alone, but I must say that better understanding of data and data trends comes from conversations with other teachers who share the same student base (grade level team, department team, or ESE teachers.) My suggestion is that you plan for a data meeting as a team. Before the meeting, all teachers gather their data and fill out step 1 prior to attending. This will save time and allow you as a team to dive right into the data discussion!
Step 1: Collect and Organize
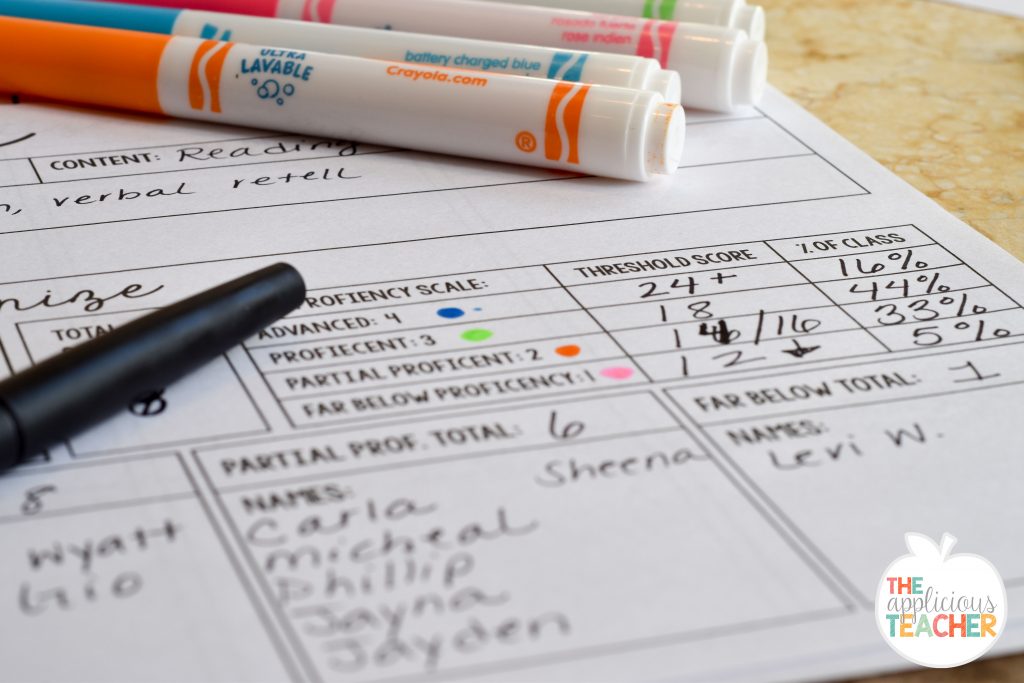
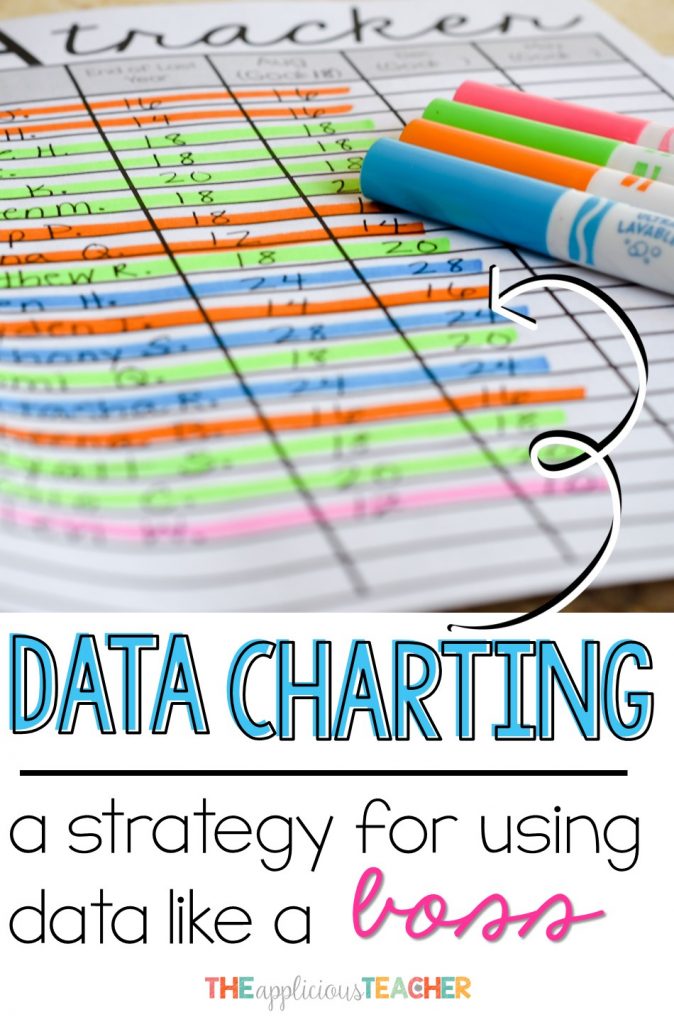
So for our example, I’m using some old first quarter DRA data (With the names changed). In second grade, we use DRAs as a diagnostic tool to check student’s reading ability three times a year. The standard DRA Proficient level for the first quarter is a DRA 18. For priority standards, skills, or concepts I wrote the 4 sections of the DRA: Phonics/decoding, reading fluency, comprehension, and verbal retell. From there, I established my threshold scores for each level:
Advanced: 24+
Proficient: 18
Partial Proficient: 14/16
and Below: 12 or below
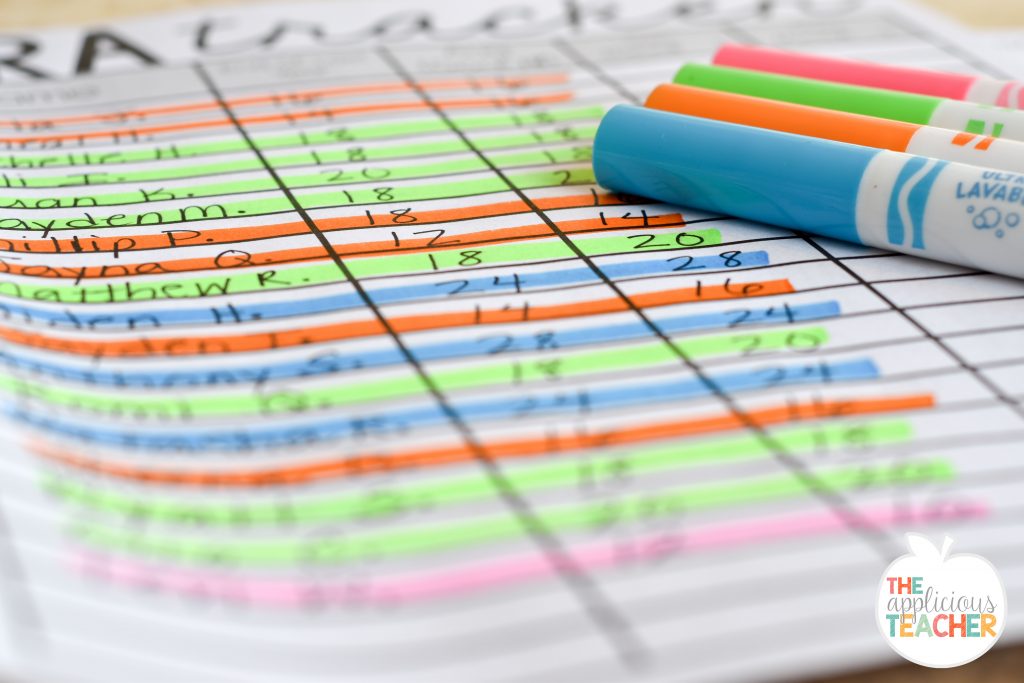
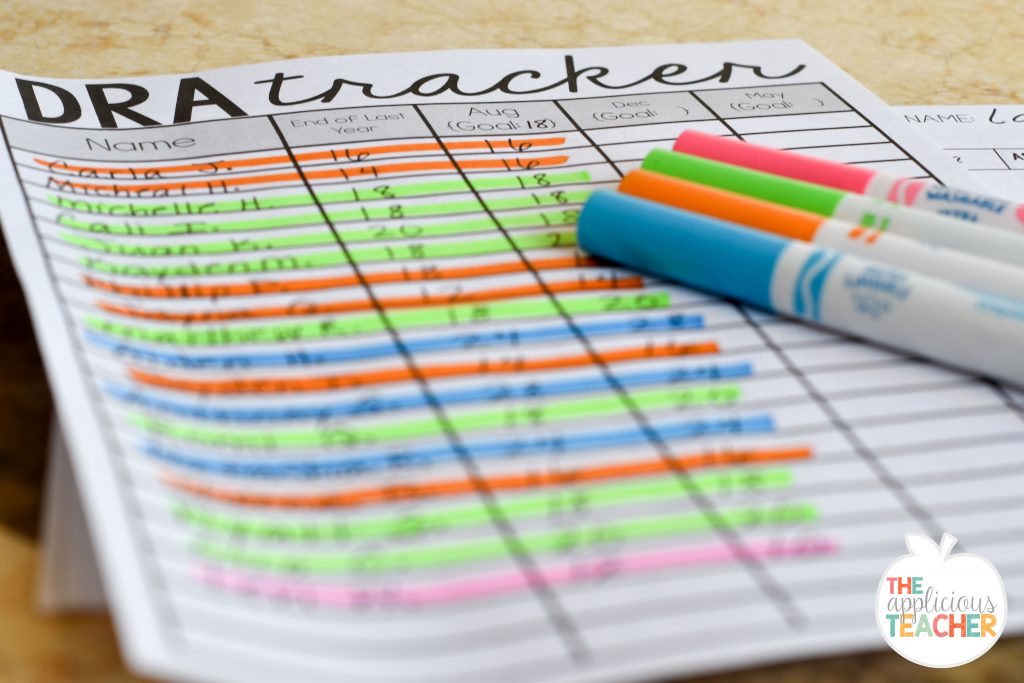
I like to color code, so I used a blue, green, orange, and pink marker to comb through my DRA data from my DRA Tracker. Anyone who scored a 24 or higher was highlighted blue, 18 or 20 was highlighted green, a 14 or 16 were colored orange, and all 12 or below were highlighted pink.
Once all my students were color coded by level, I worked to fill out the rest of Step 1. For each group, I recorded the students’ names and the total number in each group. I also calculated the percentage that each group made up of out of the entire class.
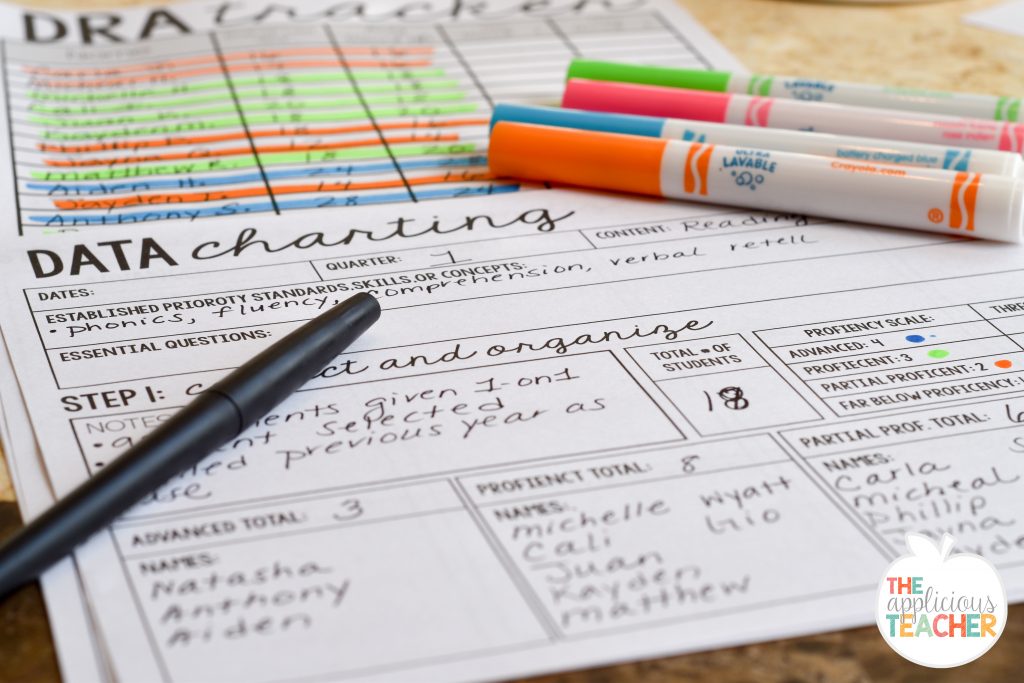
Under notes, I noted how the assessment was administered to the class. This helps ensure that standard testing procedures were used. From there we can move to Step 2.
Step 2: Analyze and Prioritize
This next step is the perfect place for you and grade team to really work together to dissect the data! For Step 2, you work to identify the skills your students are demonstrating. You also brainstorm ideas as to the root of the cause of the issues and then discuss what each group needs to learn next.
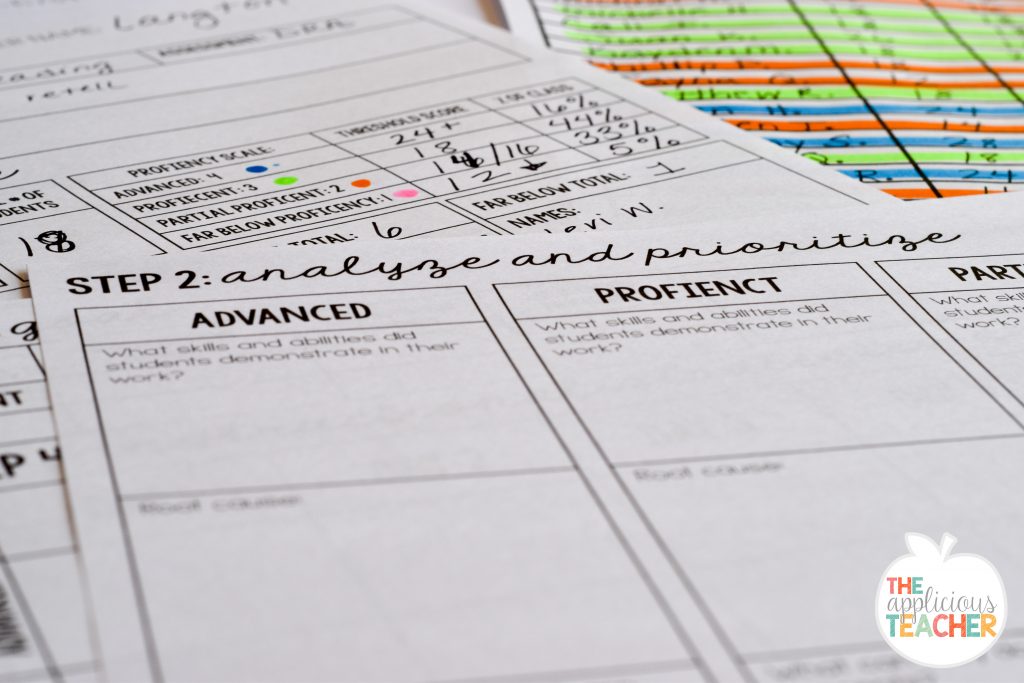
As you work through each subgroup, you and your team can see straight away what issues your lower students are having as well as how you can better support your above level learners. I like to have my assessments on hand for this piece so I can quickly glance back at their assessments and jot notes down for each student.
In most “data chats” I’ve been a part of, the conversation stops here. We’ve looked at the data and that’s it… leaving the individual teachers left to figure out how to best support their learners. (Or just twiddle their thumbs!) Now that you understand your students’ needs you’re ready to develop a plan of action.
Step 3: Goal
So we all know about Goal Setting, but this next step in the Data Charting process helps you really think about each of your groups and individual students in those groups. At the top of the sheet, you can use the number of identified students as your base, then create a goal number and percentage to match.
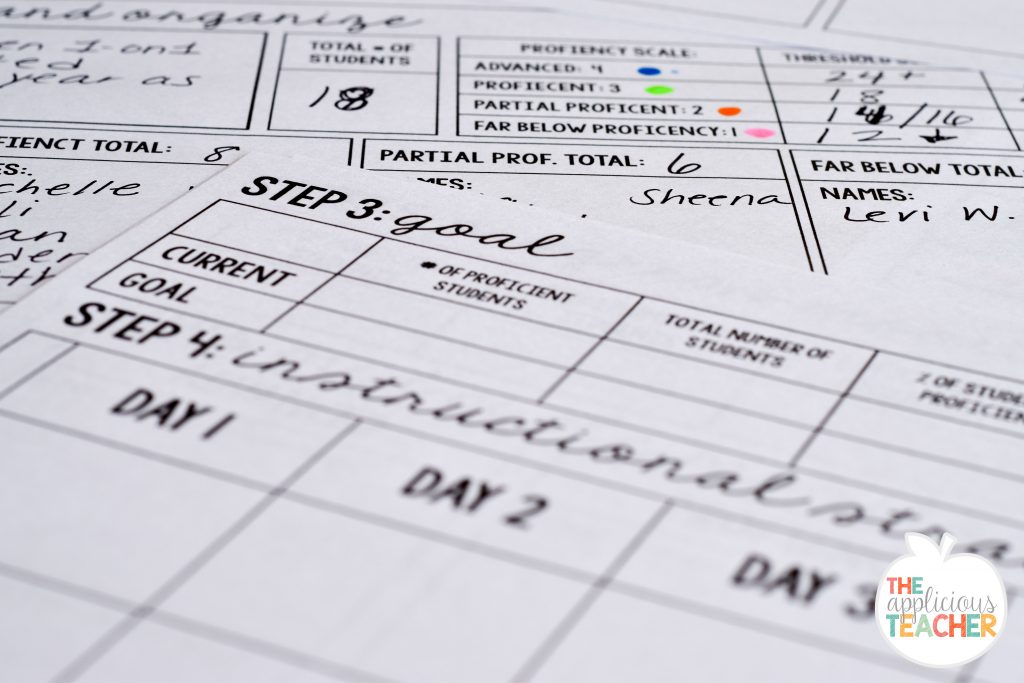
So for example, I calculated that 5% (or one student) was far below. My goal would be that 0% (or that one student) would move up to partial proficient within a certain amount of time. I continue to adjust accordingly until I’ve created percentages that I feel comfortable with. Remember, your projected growth needs to be attainable. Every teacher would love to have every student in their class on the proficient level, but if students are starting far below, a reasonable gain would be one level up. Also, proficient students may remain in the proficient category until the next round of instruction.
Step 4: Instructional Strategies and Growth
So you know where your students are and you know where you want them to go, but how are you going to get them there? Step 4 of data charting is all about creating a plan of action for each of your groups. On this sheet, there’s a 5-day lesson plan area where you can detail out how you plan to help your students reach their growth goals. At the end, you clearly define how you’ll know if students’ got it.
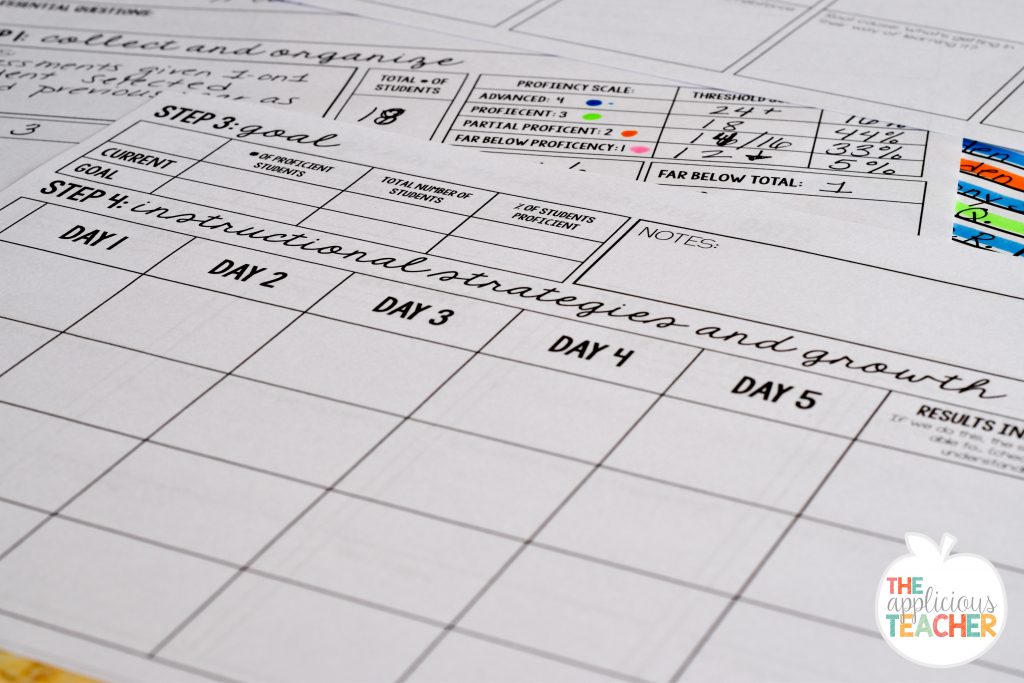
This sheet only shows 5 days, but remember you can go back to this step as many times as you need to make your students’ growth goals. This is also a great time to collaborate with your fellow teammates. If you have a group that struggled with fluency, your teammate might have an activity idea that’s worked well for them in the past and vice-versa.
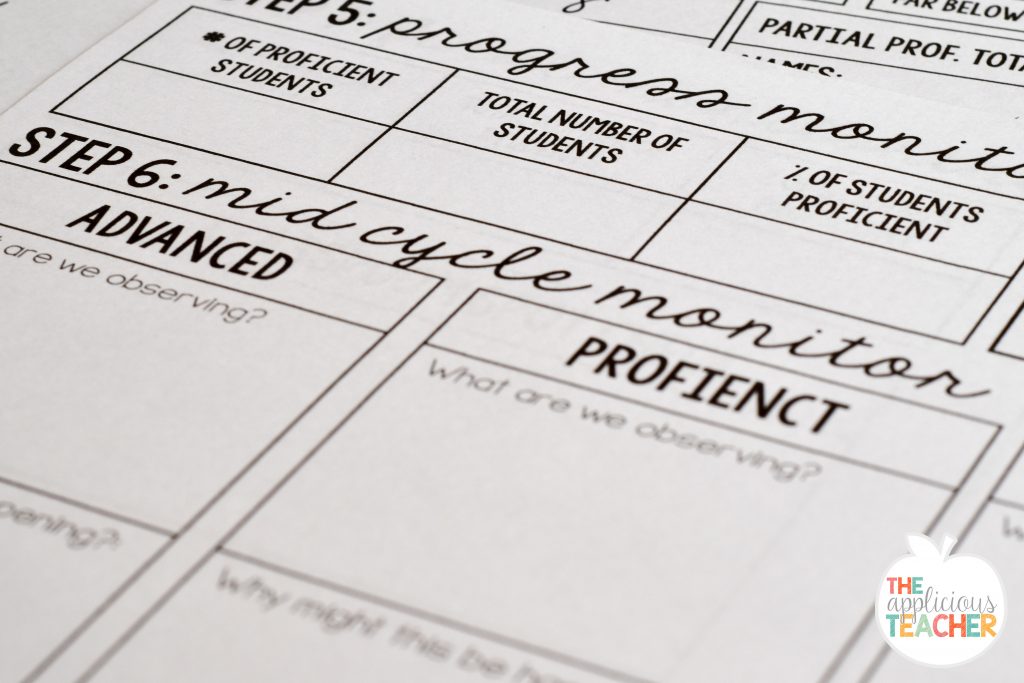
Step 5: Progress Monitoring
So, you’ve done your activities… let’s see how your kiddos responded. This step is completed after you’ve completed the first round of planned activities. If this is for intervention, this could be after 3 weeks of intervention. This is the perfect time to see if what you planned is working. If you’re not seeing an increase, this is the perfect time to rethink your strategy.
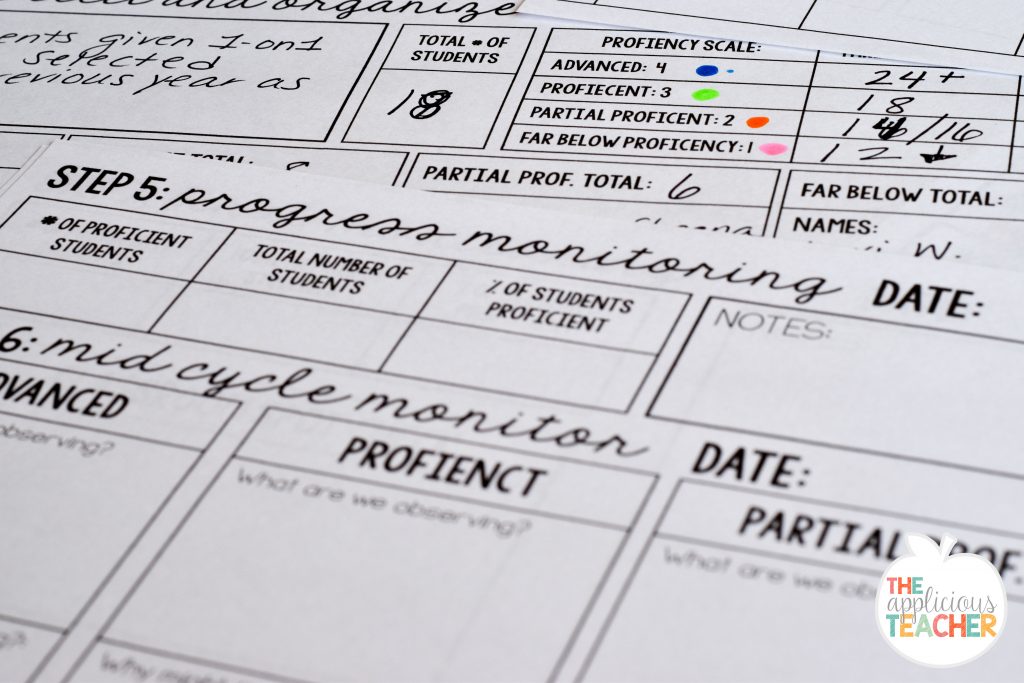
Step 5 is just a quick snapshot of growth. If you’re using this as a team data chat, I’d complete this step before attending you next data meeting. If you’re just checking it out yourself, then you’re ready to reflect on what you’re observing.
Step 6: Mid-Cycle Monitory
Are your students growing? What are you observing? Are you seeing an increase or decrease in academic achievement? Why might that be happening? These are just some of the reflection questions Data Charting has you think about as you discuss your students’ data. After you’ve spot checked your student’s progress, you’re ready to plan the next steps. Do you continue the activity, or make small adjustments? If students are increasing in fluency, but not in comprehension, you may want to go back to Step 4 and plan mini-lessons that focus on comprehension.
Step 7: Final Monitoring
Yeah! You’ve reached the final step! This may have taken 6 weeks or even a few months, but we’ve made it. Use this last page of the Data Charting Form to show your final growth stats for your students. In addition, you’ll work to identify the students who may still need intervention or enrichment.
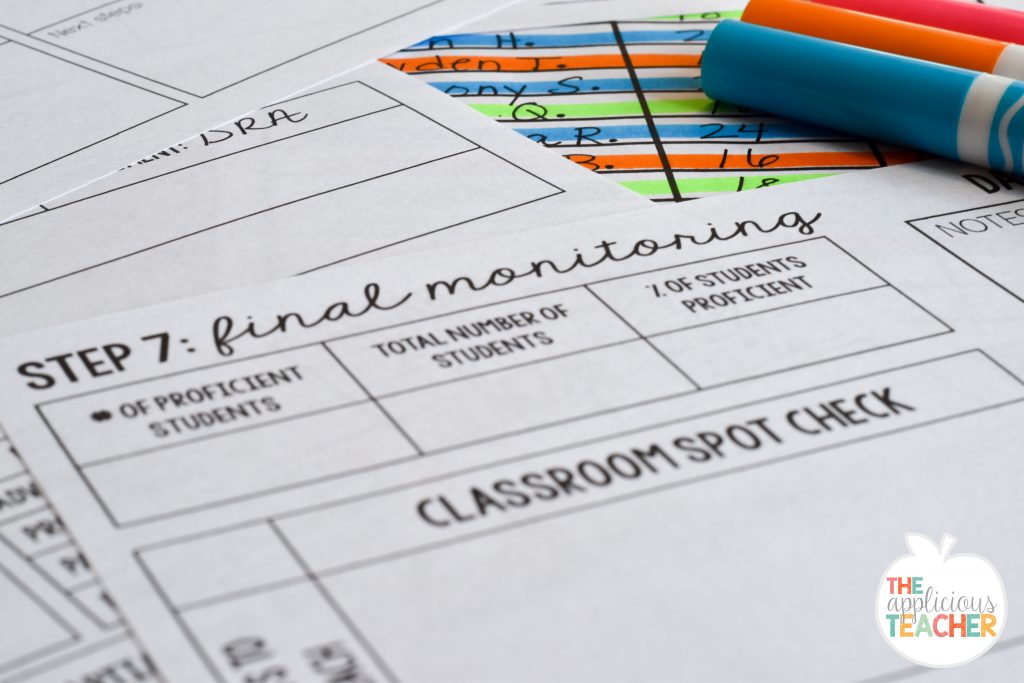
There’s also a section for you to take additional notes (on what worked or what didn’t work) as well as plans for looking forward. If a student did achieve, what’s next for them? I love that this system doesn’t only focus on one subset of students, but all of them! Every student deserves to have a full year of growth, even if they are above!
Get the System for Yourself!
Whew! All in a few weeks’ work! But I promise this process with change the way you view data in your classroom! Want to grab this awesome resource for yourself? Just sign up below and get it emailed directly to your inbox!