So we’re full swing into our Data Collection and Analysis unit, but the one graph my second graders couldn’t seem to grasp was the line plot.
I wouldn’t say it was because line plots are hard to read or even create. I think the issues stemmed from the fact that none of my seconds had any real world experience with them. And to be honest, neither had this Applicious Teacher. I mean I’ve taught them in third grade, but never in my real life had I looked, read, or created a line plot.
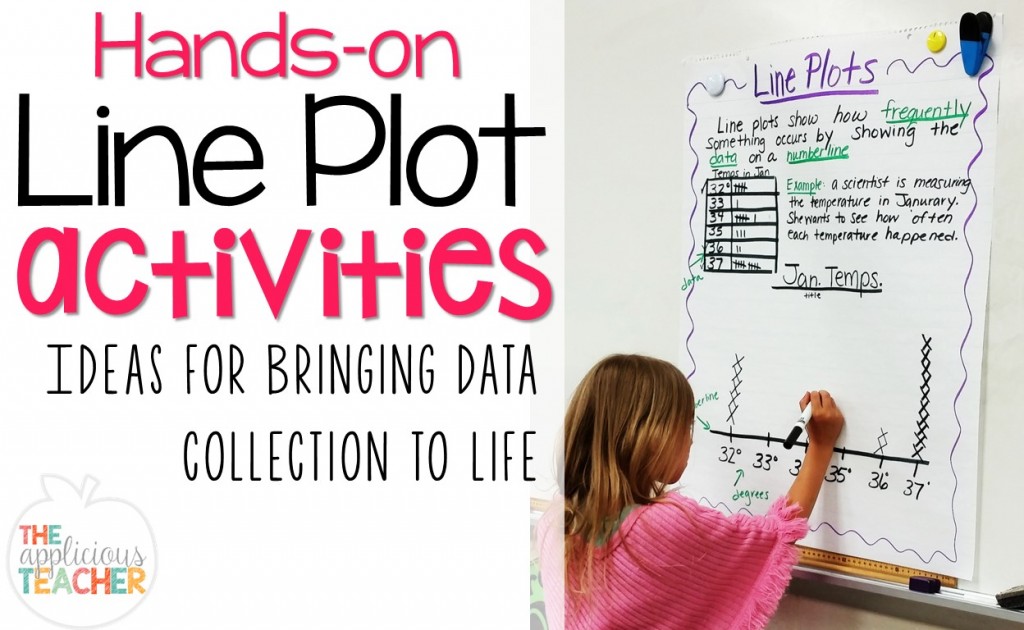
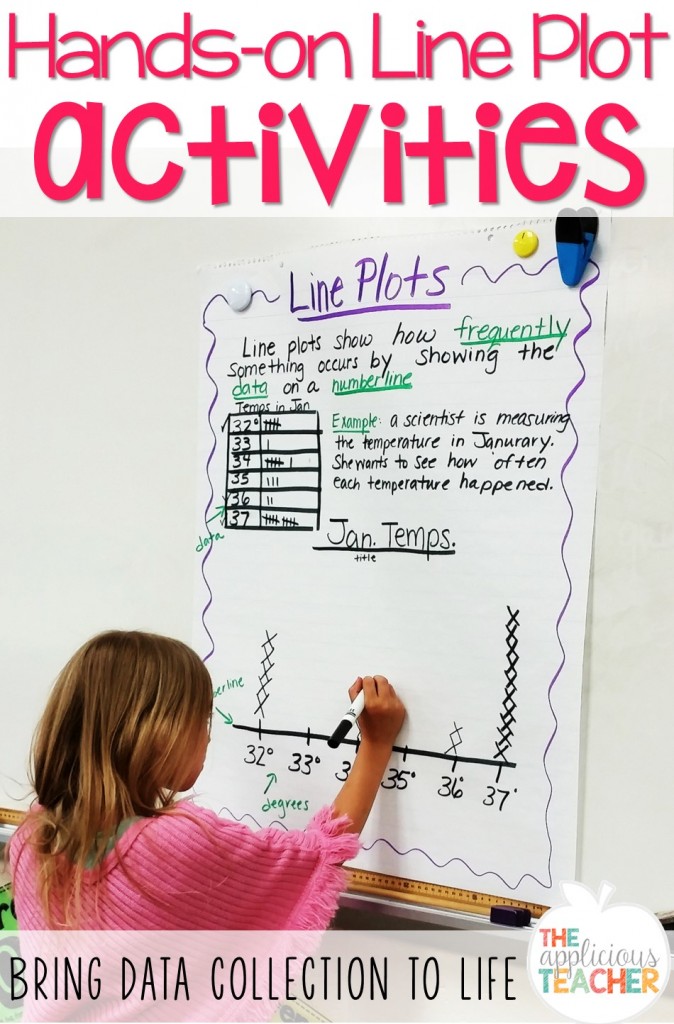
To start us off, I created this quick line plot anchor chart.
 Love anchor charts, too? Check out this board for even more ideas!
Seriously folks, nothing fancy, but it helped outline the reason behind creating this type of graph and provided a visual as to what this type of graph looked like. I wanted my kiddos to be involved in the learning (remember it’s the beginning of April and we’ve already had Spring Break. Student engagement is at on all time LOW).
So, to get my kiddos involved, I left the actual line plot uncharted. After reviewing the purpose and studying the data, we could launch into line plot action. I reviewed the different parts of a line plot graph and discussed the theory behind the numbers on the bottom of the chart.
 I modeled how to transfer the data from the chart to the line plot on the bottom. Then, I called a few students up to transcribe the rest of our data. The class voted on each of the student responses to make sure we were all on the same page. Then, it was time to make our own!
To create some “realness” to our project (remember we have no real world connection to this type of graph) I set the stage-thank you Hope King- for the students. I told students that they were all botanists. (This went perfectly with our reading and science unit on seeds and plants.) As botanists, we were asked to survey the different size leaves of the plants around our school.

Armed with plastic baggies, we headed outside to collection a sampling of 10 leaves. I gave the students only 5 minutes to find their specimens. It was a gorgeous day and this gave me about 3 minutes to work on my natural Floridian tan.
Once our 5 minutes were up, we headed back inside to start documenting our findings.
In our Math ISN, we titled our page.
 Then, made a section to write our leaf measurements. Below that the kiddos used a ruler to draw a line for the number line.
Using the centimeter side of the ruler-you know cuz we’re botanists- the kiddos measured and recorded each of their ten leaves. Then, they numbered their line plot number line starting with their lowest measurement and ending with their highest. From there, the kiddos we’re able to transcribe their data.

As a quick check of their graph, I came around and asked students questions about their line plots and checked for accuracy. The few students who struggled setting up their plots came to my small group table for reteaching and those who were done got to move on to math centers.
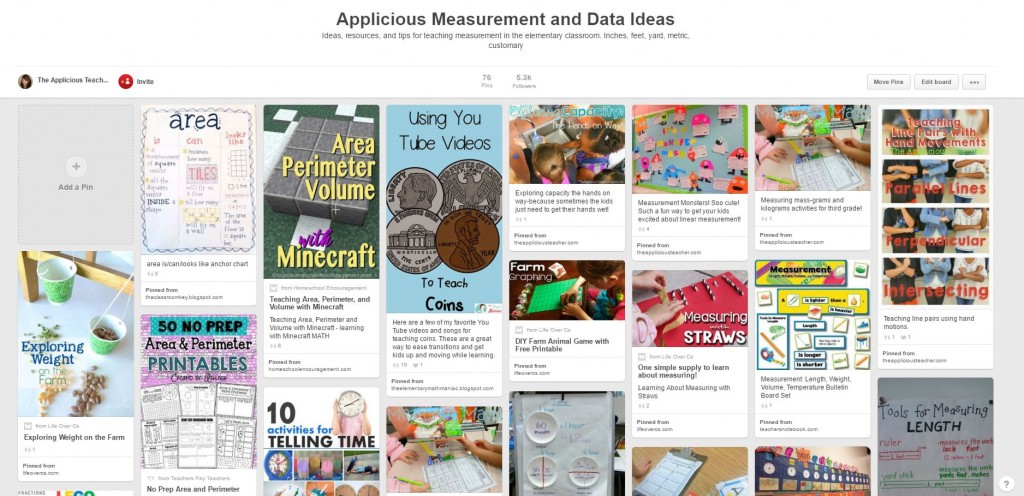
 Need some other ideas for teaching data collection? Check out my Measurement and Data board on Pinterest.